
Question-led guide · how-to
How should I trace model latency, streaming, and token usage?
A model-span profile that separates queueing, request time, time to first token, streaming, completion state, token usage, and semantic-convention version.
Direct answer
Trace one logical model attempt with separate timestamps for local queue admission, provider request start, first response byte or token, final streamed item, and attempt completion. Record outcome, cancellation, retries, model/provider identity, input and output usage as reported, and semantic-convention version. Keep application queue time outside provider latency, and never infer answer quality or invoice truth from duration and token fields alone.
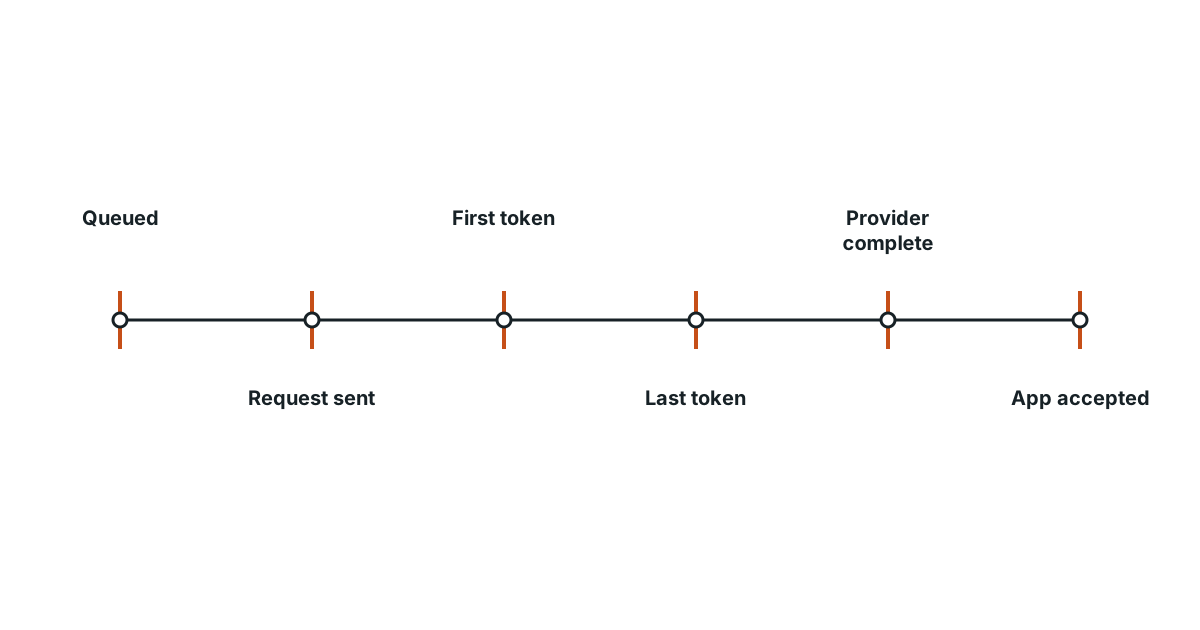
One model call, several clocks
Use this profile for synchronous or streaming model calls inside an agent. It gives operators phase and usage evidence for one attempt and for aggregates across attempts. The outer workflow should separately record user request, routing, tool work, validation, and final outcome.
Why first-token time and completion diverge
One span duration often combines local admission, rate-limit waiting, network setup, provider queueing, generation, client buffering, streaming consumption, and post-processing. A “latency regression” has no actionable location. Streaming makes the ambiguity worse: the user may care about first useful token and completion, while the backend records only total request time.
Usage fields are also overloaded. An API may report input, cached input, output, reasoning, or total tokens at different times. Converting a generic tokens number into cost or quality creates false precision.
Fast streaming, slow accepted answer
A model emits its first token in 420 ms and finishes in 5.8 s, but a safety check and JSON repair delay application acceptance to 8.1 s. Three timings are retained because each supports a different engineering decision.
Measure the span as a state transition
Capture one request at the application boundary and the raw provider event timestamps in a test environment. Compare them with span start/end, first-token metric, final-chunk event, and usage fields. Repeat for success, cancellation, timeout, retry, empty response, and error after partial stream.
Check whether:
- local queue time is attributed to the model provider;
- time to first token includes application admission;
- cancellation is mislabeled as successful completion;
- a retry creates a new attempt span under the same logical request;
- partial output and usage are retained consistently;
- model alias and resolved model/version are distinguishable.
Record latency and usage without inventing outcomes
Create one client span per provider attempt. Parent it under the logical model step and link retries where the tracing model supports it. Record standard GenAI attributes from the pinned convention version and a small set of namespaced extensions for missing phase timestamps.
Emit bounded events: request_sent, first_response, stream_completed, and usage_received. Derive queue duration, time to first response, stream duration, and total attempt duration in the telemetry pipeline. Record outcome as completed, cancelled, timed out, provider error, client error, or partial/unknown.
Keep prompt and completion content off by default. When targeted capture is approved, apply sampling, access, redaction, and retention policy separately from operational timing.
Model-span profile
The model-span profile includes:
| Field group | Required data |
|---|---|
| Identity | Trace/span, logical request, attempt, provider, requested/resolved model, region |
| Versioning | Instrumentation library, adapter, and semantic-convention snapshot |
| Phases | Queue admitted, request sent, first response, final stream item, attempt end |
| Streaming | Chunk count, bytes if useful, cancellation point, and partial-output flag |
| Outcome | Status, error type, retry reason, and provider request ID where safe |
| Usage | Provider-reported categories, units, source event, and completeness |
| Derived metrics | Queue, first response, streaming, total duration, attempts per outcome |
| Privacy | Content-capture mode, sampling, redaction, access class, and retention |
Dashboard shortcuts that mislabel model behavior
- Calling span duration “model inference time” without separating client and provider phases.
- Creating one span or high-cardinality event per token.
- Ending the span at first token and losing completion and usage behavior.
- Overwriting the first attempt when a retry occurs.
- Treating client usage telemetry as settled billing or output quality.
Evidence
OpenTelemetry's evolving GenAI semantic conventions define span attributes for model-system identity, request/response properties, operation names, and token usage.
The pinned GenAI span-convention snapshot describes client-span naming, attributes, events, errors, and examples for model operations.
Primary source · standard · checked Aug 26, 2026
Limit: The conventions are evolving, SDK support varies, and custom timing fields may be needed until semantics stabilize.
GenAI metrics conventions distinguish operation duration and token-usage measurements with defined attributes and units.
The pinned metric-convention snapshot defines GenAI operation duration and client token-usage metric guidance.
Primary source · standard · checked Aug 26, 2026
Limit: Metrics aggregate observed telemetry and do not establish provider billing, end-user latency, or output quality.
Streaming observability should represent phase boundaries and attempt outcomes without creating nested spans for every token.
The model-span profile below adds bounded phase events and derived metrics around the standard attempt span.
Signal Studio author framework · reviewed Aug 26, 2026
Limit: Provider APIs expose different streaming events, usage timing, and queue signals, so adapters need tested mappings.
Limitations
Client clocks, buffering, proxies, SDK behavior, network transport, provider queues, and streaming protocols affect phase measurements. Token counts may arrive only at completion or use provider-specific categories. Instrumentation must be versioned and validated against captured API behavior.
FAQ
- Should every streamed token be a span or event?
- Usually no. That creates volume and cardinality without proportional diagnostic value. Record bounded phase events and aggregate chunk counts or sizes unless a targeted investigation requires more detail.
- Can I compute model cost from token telemetry?
- You can estimate when provider usage categories and dated prices are mapped correctly. Reconcile estimates with provider billing; cached, reasoning, batch, and other categories can differ.
Related guides
Continue within AI agent observability, or use one of these adjacent diagnostics:
Editorial QA: automated native-English, structure, source-presence, and link checks completed . This record is not an independent expert endorsement. Review boundary.