
Question-led guide · how-to
How should ClickHouse tables follow observability investigation queries?
Design signal tables, typed columns, sort keys, and derived views from investigation steps while preserving tenant scope, timestamps, and signal meaning.
Direct answer
List the investigations the product must support before choosing table layouts. Preserve each signal’s meaning in a canonical representation, promote frequently filtered fields deliberately, and evaluate ordering and derived structures against concrete query shapes. Measure both result correctness and background work under ingestion; a faster lookup is useful only if the intended records remain in scope.
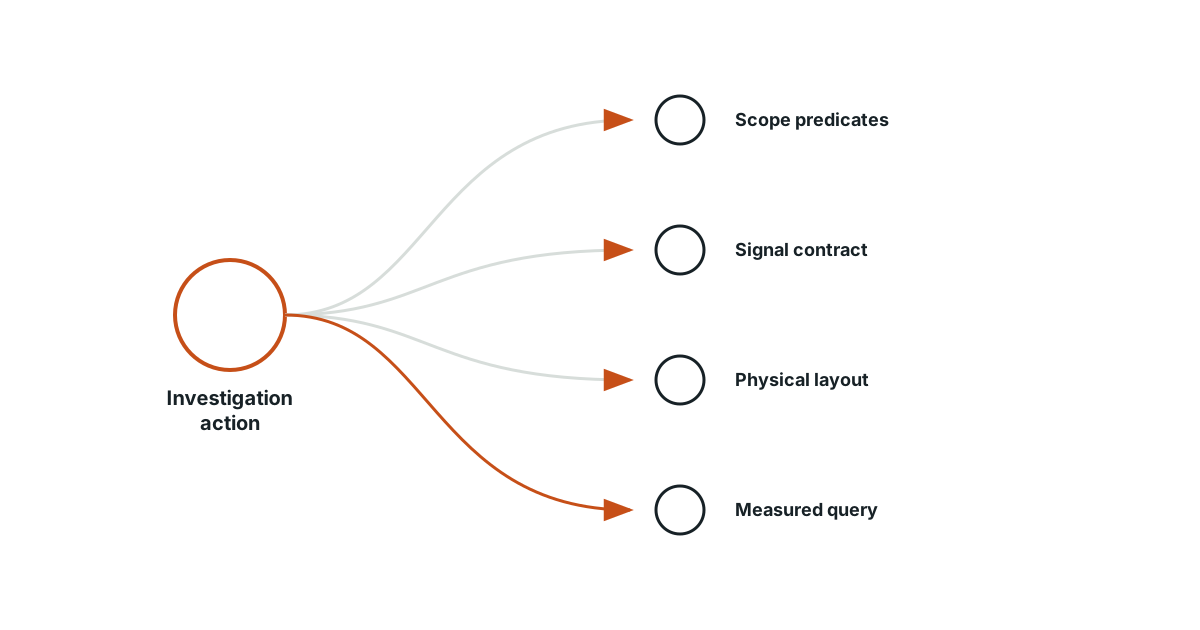
Name the action behind each query
“Query telemetry” is too broad to design a table. Opening a five-minute service chart, finding ten slow requests, and reconstructing a selected trace have different filters, row counts, and ordering needs. Write those actions down with the fields the screen actually returns. Add the tenant, environment, time range, freshness target, and expected result size.
Preserve canonical signal meaning
Logs, spans, and metric points can share identity conventions without becoming one undifferentiated event table. A span has a duration and parent relationship. A log can have both event time and observed time. A metric point carries measurement semantics. Preserve those distinctions before designing a shared search experience; otherwise a convenient column name can encourage an invalid interpretation.
Treat the sorting key as a workload choice
Use representative predicates to compare candidate layouts. A layout helpful for tenant-and-time filtering may be less helpful for reconstruction by trace identity. Avoid declaring a universal ordering key from a toy query. Track rows and bytes read, latency distribution, and ingestion cost for each candidate. Keep enough information to explain why the chosen tradeoff serves the supported investigation.
Promote attributes with a reason
A frequently filtered service or deployment field may deserve a typed column. An infrequently used attribute may remain in a flexible representation. Record units, allowed values, missing-value behavior, and the authority that supplies tenant scope. Do not silently trust a client-provided tenant label simply because it occupies a convenient column.
| Investigation | Essential constraint | Layout experiment |
|---|---|---|
| Service chart | Compatible population and time bucket | Aggregation over scoped rows |
| Slow-trace candidates | Duration and bounded time interval | Selective filtering and ordering |
| Trace reconstruction | Exact authorized trace identity | Lookup with sufficient span coverage |
| Related logs | Exact correlation or explicit broad search | Identifier and time predicates |
Add a derived structure with a correction story
A materialized view, lookup table, or projection should remove named query work. Specify its population, freshness, and repair method. If a promoted field changes interpretation, determine whether historical derived data needs rebuilding. Measure additional inserts, storage, and merges; accelerating one screen should not quietly consume the reserve used by the ingestion service.
Compare answers before comparing speed
In an illustrative review, two layouts return the same ten trace IDs, but one omits late-arriving child spans from reconstruction. Equal candidate lists do not establish equal investigations. Include late data, missing attributes, long traces, and an unauthorized tenant in the test set. Accept the design only when each query meets its semantic contract as well as its performance target.
Evidence and scope
- Designing a schema for observability: ClickHouse schema choices should follow the filters and access patterns used by observability queries.
- OpenTelemetry logs data model: The logs model distinguishes event and observed timestamps and defines optional trace and span identifiers.
The proposed checks are teaching tools; validate their behavior in the actual environment.
Evidence
ClickHouse schema choices should follow the filters and access patterns used by observability queries.
ClickHouse schema choices should follow the filters and access patterns used by observability queries.
Primary source · official-doc · checked Sep 11, 2026
Limit: This source supports the named mechanism, not the outcome or thresholds of the illustrative workflow.
The logs model distinguishes event and observed timestamps and defines optional trace and span identifiers.
The logs model distinguishes event and observed timestamps and defines optional trace and span identifiers.
Primary source · official-doc · checked Sep 11, 2026
Limit: This source supports the named mechanism, not the outcome or thresholds of the illustrative workflow.
Limitations
The scenarios and decision worksheets are original teaching examples. They are not measured deployments or guarantees; adapt the checks to the actual system and its documented behavior.
FAQ
- Should all telemetry share one table?
- Shared navigation does not require identical storage. Choose representations that preserve each signal’s semantics and support the actual queries.
- Should every attribute become a column?
- Promote fields when their frequency, type stability, and query value justify the ingestion and maintenance cost.
Related guides
Continue within ClickHouse observability, or use one of these adjacent diagnostics:
Editorial QA: automated native-English, structure, source-presence, and link checks completed . This record is not an independent expert endorsement. Review boundary.