
Question-led guide · how-to
How do I preserve OpenTelemetry metric meaning in ClickHouse?
A metric ingestion and query contract for units, temporality, start times, identity, histogram compatibility, resets, and sampling populations.
Direct answer
Keep metric type, unit, temporality, start and end timestamps, resource identity, and point attributes with the values. Choose query operations from that contract rather than applying one sum or average to every numeric column. Preserve compatible histogram structure and distinguish native metrics from statistics derived from sampled spans before comparing charts or building alerts.
Ask what the number measures
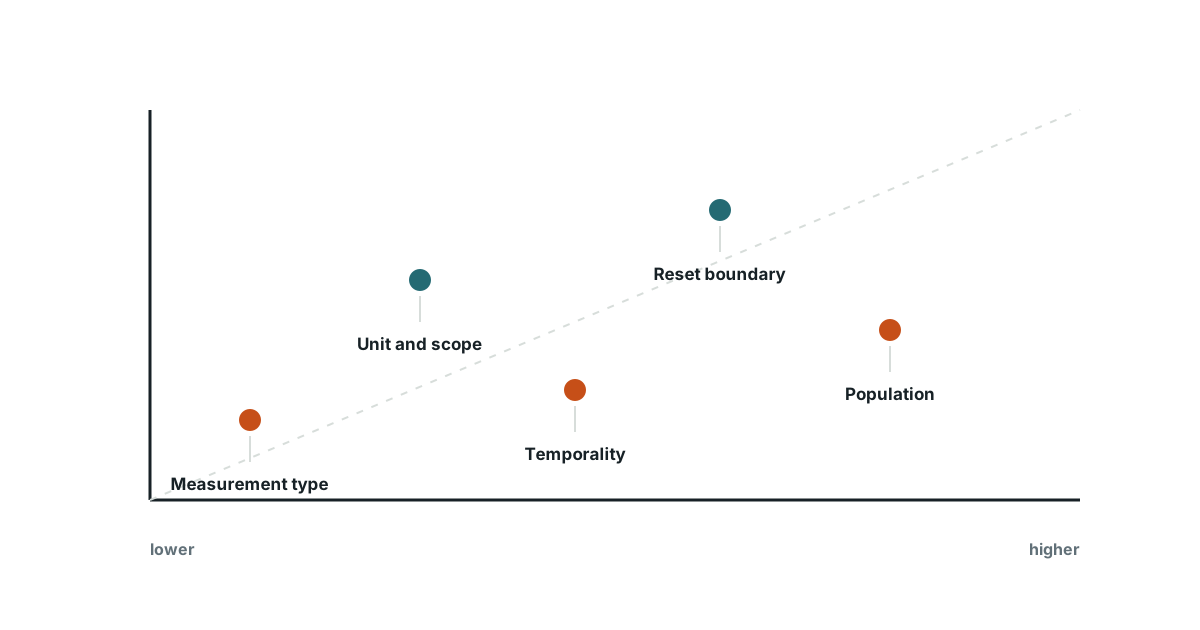
An invented checkout chart shows 120 beside the label “requests.” That number might be a count for one minute, a cumulative count since startup, or a retained-span count after sampling. Each interpretation supports a different query. Require the measurement contract before investigating a sudden rise; a new exporter configuration may have changed interpretation while the chart label stayed the same.
Retain the time information needed for resets
Cumulative measurements require a way to reason about their accumulation period and discontinuities. Keep the relevant start timestamp rather than retaining only the collection time. A process restart can reset a counter without representing negative work. Missing observations and out-of-order arrival also deserve defined handling. Do not turn every decrease into either a real negative rate or an automatic zero without justification.
Separate additive and non-additive operations
A sum may support addition across compatible partitions of a population. A gauge describes an observation whose aggregation depends on the question. Averaging machine temperatures is different from adding request counts. Make the permitted operations part of the metric definition and review any rollup that changes the grouping dimensions.
Merge distributions only under a compatible contract
Histogram aggregation requires compatible units and representations. Do not average service-level p99 values and call the result the fleet p99: the quantiles do not retain the information needed for that calculation. Preserve an aggregatable distribution or use an explicitly approximate method with documented input requirements. Mark gaps in coverage rather than presenting a smooth chart as complete evidence.
| Contract field | Failure it helps reveal |
|---|---|
| Unit | Milliseconds merged with seconds |
| Temporality | Interval counts treated as lifetime counts |
| Start time | Process resets hidden inside a rate |
| Resource and attributes | Distinct populations accidentally merged |
| Histogram shape | Incompatible distributions combined |
| Collection population | Sampled traces presented as all requests |
Trace a chart back to its population
Native request metrics and metrics derived from retained spans may disagree because they count different populations. An error-biased sampling policy can make a stored-span error fraction much larger than the actual request error fraction. Label the chart’s source and denominator. A useful link to representative traces does not make the trace sample statistically representative of the complete service.
Test the contract with deliberately awkward points
Create a small fixture containing a reset, a missing interval, late data, mixed units, and distinct tenants. Write the expected interpretation before running the aggregation. Then compare the canonical data, rolled-up data, and chart result. In this original review exercise, a refused incompatible merge is a better outcome than a plausible number produced by a generic numeric query.
Evidence and scope
- OpenTelemetry metrics data model: Metric points carry measurement types and temporality; compatible aggregation depends on preserving those distinctions.
- Designing a schema for observability: ClickHouse schema choices should follow the filters and access patterns used by observability queries.
The proposed checks are teaching tools; validate their behavior in the actual environment.
Evidence
Metric points carry measurement types and temporality; compatible aggregation depends on preserving those distinctions.
Metric points carry measurement types and temporality; compatible aggregation depends on preserving those distinctions.
Primary source · official-doc · checked Sep 11, 2026
Limit: This source supports the named mechanism, not the outcome or thresholds of the illustrative workflow.
ClickHouse schema choices should follow the filters and access patterns used by observability queries.
ClickHouse schema choices should follow the filters and access patterns used by observability queries.
Primary source · official-doc · checked Sep 11, 2026
Limit: This source supports the named mechanism, not the outcome or thresholds of the illustrative workflow.
Limitations
The scenarios and decision worksheets are original teaching examples. They are not measured deployments or guarantees; adapt the checks to the actual system and its documented behavior.
FAQ
- Can I average p99 latency across services?
- That generally does not yield the combined population’s p99. Use compatible distribution data or a method with explicitly stated approximation limits.
- Why do span-derived metrics disagree with request metrics?
- Sampling, dropped records, different instrumentation boundaries, and differing populations can all change the denominator.
Related guides
Continue within ClickHouse observability, or use one of these adjacent diagnostics:
Editorial QA: automated native-English, structure, source-presence, and link checks completed . This record is not an independent expert endorsement. Review boundary.