
Question-led guide · diagnostic
How should a unified investigation explain missing telemetry?
Design empty results and signal pivots around ingestion freshness, sampling, retention, authorization, correlation quality, and visible coverage gaps.
Direct answer
An empty result should preserve the query scope and explain what is known about collection, ingestion freshness, sampling, retention, and access. Distinguish an exact trace-linked pivot from a broader time-window search. Show uncertainty when coverage is incomplete so that an investigator does not mistake unavailable evidence for proof that an event never happened.
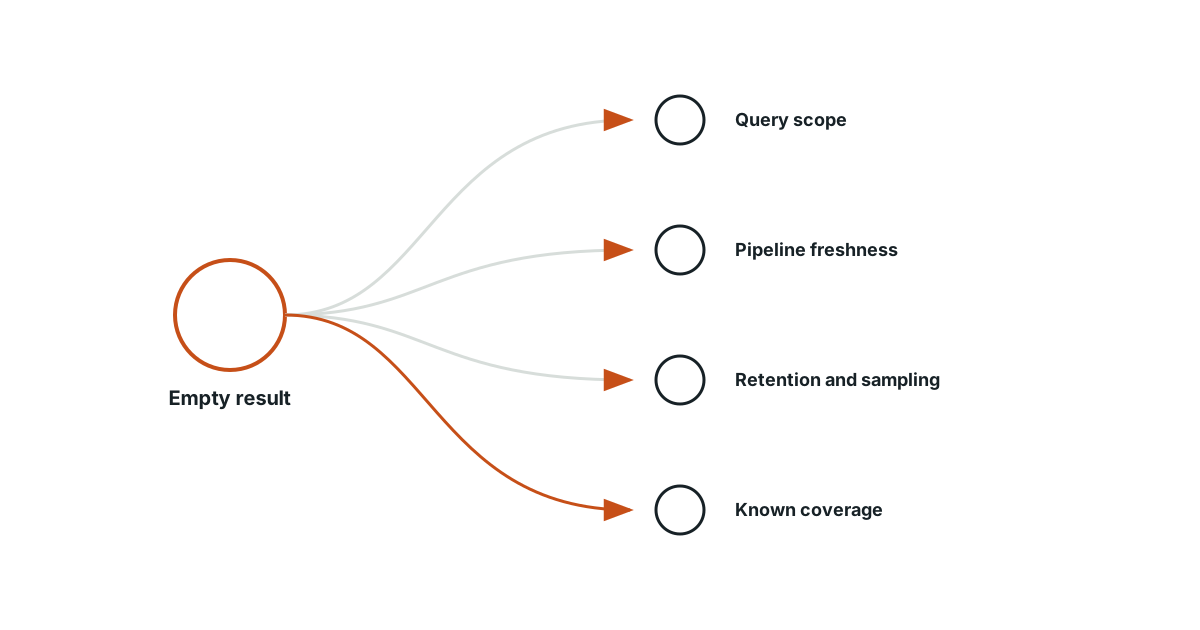
Make an empty panel an observable state
In a fictional incident, an engineer selects a failed checkout trace and finds no payment logs. That absence could mean the payment operation emitted no logs, ingestion is delayed, retention removed them, access excluded them, or correlation is missing. The screen should preserve these alternatives until evidence narrows them. A green “no errors” label would claim more than the query established.
Carry the selected scope through every pivot
Keep tenant, environment, service, interval, and selected identifiers visible when moving between signals. If the application widens the time window or drops an identifier filter, show the change. Otherwise users may believe that a broad log search is an exact continuation of their trace. Useful navigation needs continuity of meaning as well as a convenient click.
Distinguish exact links from contextual searches
A log containing a valid trace and span association supports a different relationship from a log emitted by the same service nearby in time. Offer the second search when it helps, but label it as contextual. Preserve event time and observed time where available: ingestion delay can explain why a recent search failed even though the event later appears.
Attach coverage to the result
Use the signals the platform can actually observe. An ingestion watermark can reveal staleness; a retention policy can explain an expired interval; sampling metadata can describe a reduced population. Do not claim total completeness from one healthy component. If the collection layer provides no evidence about dropped data, the honest state is unknown coverage.
| Observed condition | Reader-facing interpretation |
|---|---|
| Storage consumer behind | Newer admitted records may still be pending |
| Requested interval expired | Data may be outside configured retention |
| Missing trace association | Offer a clearly labeled contextual search |
| Restricted query scope | Explain the visible scope without revealing hidden records |
| No loss measurement | Completeness remains unverified |
Keep access explanations from leaking information
An application should not reveal whether a forbidden tenant has a matching log merely to make an empty state friendlier. Explain the caller’s authorized scope and provide a governed escalation path. Keep internal permission diagnostics separate from public result text. An investigation interface can be transparent about its limits without exposing records beyond the user’s authority.
Replay one incomplete incident journey
Test a trace with a delayed log, an expired interval, a sampled-away span, and a forbidden resource. Ask a reviewer to state what each screen proves. If the reviewer concludes that an event did not occur when the screen only proves that no matching record is currently visible, revise the labels and evidence. The acceptance condition is an intelligible investigation, not just four functioning charts.
Evidence and scope
- OpenTelemetry logs data model: The logs model distinguishes event and observed timestamps and defines optional trace and span identifiers.
- OTLP specification: OTLP defines response, retry, and partial-success behavior at the receiving endpoint.
The proposed checks are teaching tools; validate their behavior in the actual environment.
Evidence
The logs model distinguishes event and observed timestamps and defines optional trace and span identifiers.
The logs model distinguishes event and observed timestamps and defines optional trace and span identifiers.
Primary source · official-doc · checked Sep 11, 2026
Limit: This source supports the named mechanism, not the outcome or thresholds of the illustrative workflow.
OTLP defines response, retry, and partial-success behavior at the receiving endpoint.
OTLP defines response, retry, and partial-success behavior at the receiving endpoint.
Primary source · official-doc · checked Sep 11, 2026
Limit: This source supports the named mechanism, not the outcome or thresholds of the illustrative workflow.
Limitations
The scenarios and decision worksheets are original teaching examples. They are not measured deployments or guarantees; adapt the checks to the actual system and its documented behavior.
FAQ
- Does an empty log query prove that no error occurred?
- No. It proves only that the query returned no visible matching records under its current scope and coverage.
- Should every pivot use the same time window?
- Preserve the original scope and show any deliberate expansion, especially for long traces or delayed data.
Related guides
Continue within ClickHouse observability, or use one of these adjacent diagnostics:
Editorial QA: automated native-English, structure, source-presence, and link checks completed . This record is not an independent expert endorsement. Review boundary.