
Question-led guide · planning
How do I size a million-spans-per-second observability workload?
A capacity worksheet that separates record rates, payload bytes, retained storage, replicas, recovery, and the queries an observability platform must serve.
Direct answer
Start with separate span, log, and metric rates, then measure record-size distributions, retained fractions, retention periods, and storage overhead. Add burst and outage assumptions before measuring ingestion alongside real investigation queries. A million spans per second describes an arrival rate; it does not determine node count, query latency, or a durability guarantee.
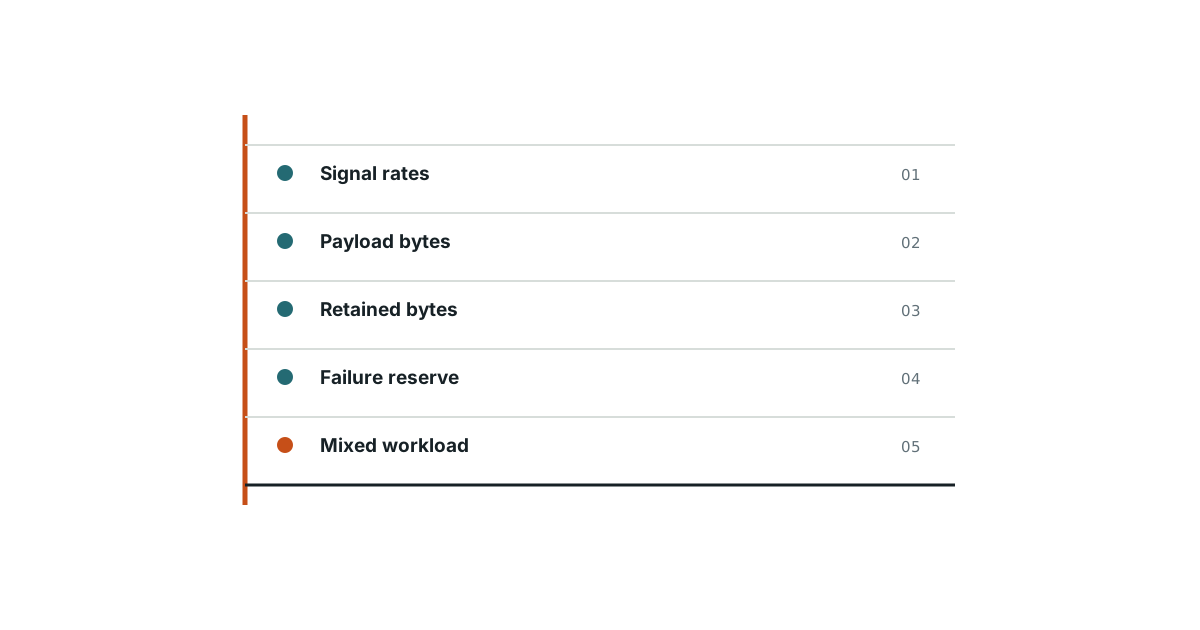
Begin with three independent arrival streams
An application request can emit several spans, many logs, and no new infrastructure metric point. Count those streams independently. Record whether a rate describes generated, exported, accepted, or stored records. Sampling and retries can make all four numbers different, and planning against the smallest counter can conceal the traffic the collection layer must survive.
Convert a rate into an auditable byte budget
Consider an invented planning exercise: 1,000,000 spans per second, 900 encoded bytes per span, and 300 compressed bytes per retained row. Before overhead or sampling, the payload rate is 900 MB/s and the base-row rate is 300 MB/s, using decimal units. The latter gives 25.92 TB per day. These sizes are assumptions to replace with measurements, not compression promises.
Keep retention separate from replication
Three days of those span rows require 77.76 TB of base storage. Two copies make that 155.52 TB before indexes, derived tables, merge space, backups, and free-space reserve. Add logs and metrics as separate worksheet rows. Do not multiply every storage item by the same replication factor if the architecture gives them different policies.
| Worksheet term | What to record | Evidence needed |
|---|---|---|
| Arrival | Steady and burst records per second | Producer and ingress counters |
| Encoded size | Mean and upper-tail bytes | Representative payload sample |
| Stored size | Compressed bytes per retained record | Loaded production-like data |
| Lifetime | Raw and derived retention | Query and recovery requirements |
| Headroom | Merges, replay, and failure reserve | Mixed-workload exercise |
Give each buffer an outage to absorb
At 900 MB/s, ten minutes of uncompressed span payload represents 540 GB before framing and queue overhead. That calculation does not size a broker by itself: compression, copies, partition skew, logs, and consumption during the outage matter. State whether the buffer protects against a process restart, an unavailable database, or loss of a node. These are different failure domains.
Measure with the investigator in the room
Build a small workload of actual actions: open a service chart, find slow trace candidates, reconstruct one trace, search related logs, and refresh an alert. Run it while ingestion, merges, and replay are active. Record tail latency, freshness, failed writes, and recovery time together. A fast insert benchmark can coexist with an unusable investigation screen.
Choose a capacity claim you can defend
A useful result reads: this configuration sustained the specified arrival distribution and query mix for the stated duration while meeting the stated freshness and loss limits. Include the versions, storage layout, sampling policy, and failure exercised. If the only evidence is a worksheet, call it a planning estimate. Use the next measurement to replace the assumption with the largest consequence first.
Evidence and scope
- Designing a schema for observability: ClickHouse schema choices should follow the filters and access patterns used by observability queries.
- OpenTelemetry Collector resiliency: Collector sending queues can use persistent storage, while queue capacity and storage survival bound recovery.
The proposed checks are teaching tools; validate their behavior in the actual environment.
Evidence
ClickHouse schema choices should follow the filters and access patterns used by observability queries.
ClickHouse schema choices should follow the filters and access patterns used by observability queries.
Primary source · official-doc · checked Sep 11, 2026
Limit: This source supports the named mechanism, not the outcome or thresholds of the illustrative workflow.
Collector sending queues can use persistent storage, while queue capacity and storage survival bound recovery.
Collector sending queues can use persistent storage, while queue capacity and storage survival bound recovery.
Primary source · official-doc · checked Sep 11, 2026
Limit: This source supports the named mechanism, not the outcome or thresholds of the illustrative workflow.
Limitations
The scenarios and decision worksheets are original teaching examples. They are not measured deployments or guarantees; adapt the checks to the actual system and its documented behavior.
FAQ
- Can I size the cluster from span rate alone?
- No. Record sizes, retention, query work, failure recovery, and overhead can dominate the same span rate.
- Does the book claim measured million-span throughput?
- The scale scenario is a design and arithmetic exercise. Real capacity requires measurements of a specified implementation.
Related guides
Continue within ClickHouse observability, or use one of these adjacent diagnostics:
Editorial QA: automated native-English, structure, source-presence, and link checks completed . This record is not an independent expert endorsement. Review boundary.