
Question-led guide · evaluation
How do I test cross-domain observability coverage?
Verify whether applications, infrastructure, digital experience, and change records connect during one incident without false correlations.
Direct answer
Choose a representative failure that crosses at least two operating domains and trace the investigation from user symptom to supported evidence. Record the identities and time windows used to join application, infrastructure, experience, and change data. Test both an available-signal path and a missing-signal path. Coverage means a reviewer can explain what is observed and unknown; it is not a count of integrations or dashboards.
Start from the user-visible symptom
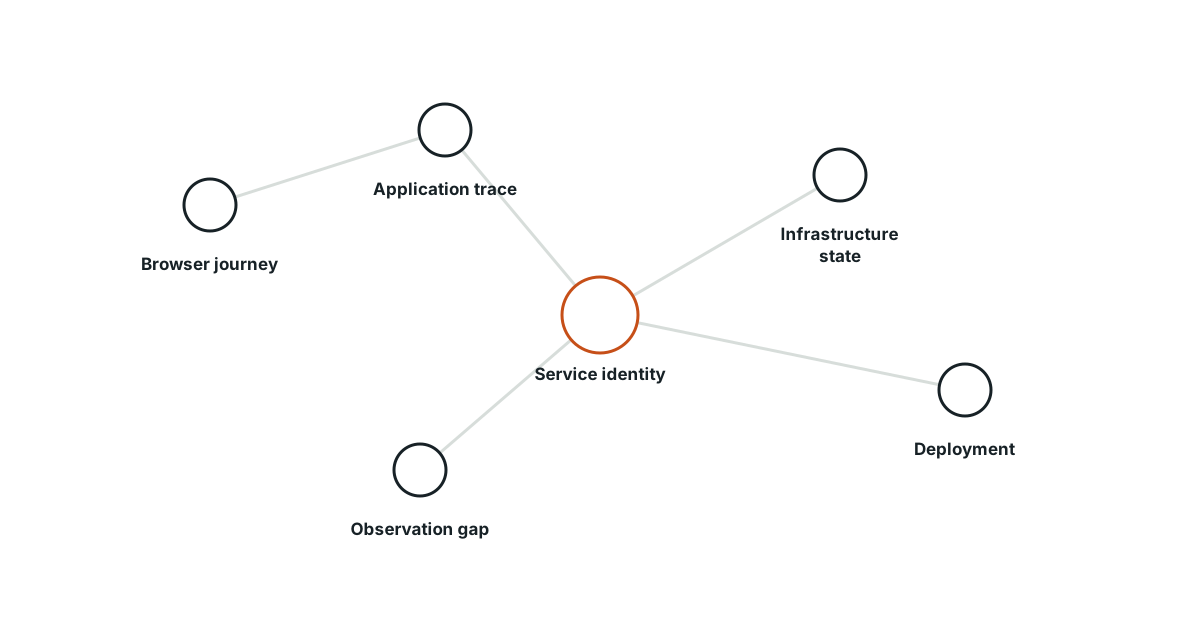
An infrastructure dashboard can look healthy while a particular user journey fails. Define the transaction, affected population, location, and time. Then identify the application, runtime, network, and change evidence needed to explain it. A platform may ingest every source and still fail to connect them in a way an investigator can verify.
Inspect the joins, not the link count
A trace ID can connect events within an instrumented request, while resource attributes and deployment identifiers may connect across systems. A shared hostname or broad time window is weaker evidence. Require the platform to show the join key, source, and uncertainty for each transition. Sampling, clock skew, and delayed ingestion can create missing links that should remain visible.
The browser error and host alert coincide
In a fictional travel service, customers in one region see a payment error at 16:10. A host CPU alert fires at 16:12 in the same region. The platform’s timeline places them together, but the failing browser requests trace to a payment-provider timeout on a different service. The host alert may be relevant background; the team does not assign cause without an identity and mechanism path.
Build an investigation map
Write what each domain contributes and how it connects.
| Domain | Evidence object | Join and gap check |
|---|---|---|
| Experience | Failed user transaction | Session or request identity |
| Application | Trace and service error | Trace coverage and propagation |
| Infrastructure | Node and dependency health | Resource identity and time |
| Change | Deployment revision | Cohort and valid interval |
| Operations | Incident record | Human interpretation and override |
Run a case with a deliberately missing signal
Disable one telemetry source in a controlled test or use a case with known collection failure. Ask whether the UI clearly identifies the gap and still supports a bounded conclusion. A platform that fills the blank with an inferred dependency should label that inference. Keep raw source evidence available for a reviewer to challenge a joined timeline.
Grade the path to a defensible answer
Measure whether investigators identify affected scope, plausible causes, disconfirming evidence, and the observation gaps that limit confidence. Count incorrect joins separately from missing integrations. Give a passing result only for the specific versions, instrumentation, and role permissions tested. The next integration should be chosen by the decision that remained blocked, not by a desire to increase connector count.
Evidence boundary for cross-domain coverage
- OpenTelemetry resource conventions: OpenTelemetry defines resource identity attributes that can support scoped joins. Matching attributes do not themselves prove an incident cause.
- OpenTelemetry signals: OpenTelemetry describes signal roles and how they represent system behavior. The documentation does not guarantee complete cross-domain instrumentation.
The travel-service incident is fictional. Real coverage must be tested with deployed instrumentation and source provenance.
Evidence
Resource attributes identify telemetry-producing entities.
OpenTelemetry defines resource identity attributes that can support scoped joins.
Primary source · official-doc · checked Oct 7, 2026
Limit: Matching attributes do not themselves prove an incident cause.
Traces, metrics, and logs provide distinct forms of observation.
OpenTelemetry describes signal roles and how they represent system behavior.
Primary source · official-doc · checked Oct 7, 2026
Limit: The documentation does not guarantee complete cross-domain instrumentation.
Limitations
The map tests a selected journey. Other user populations, telemetry gaps, and permissions may expose different failures.
FAQ
- Does ingesting every data source mean we have coverage?
- No. Investigators must be able to join relevant evidence correctly and see when a link is missing or uncertain.
- Can a shared timestamp establish cause?
- No. It is context for a hypothesis; identity, chronology, and mechanism-specific tests are still needed.
Related guides
Continue within Enterprise observability platform selection, or use one of these adjacent diagnostics:
Editorial QA: automated native-English, structure, source-presence, and link checks completed . This record is not an independent expert endorsement. Review boundary.