
Question-led guide · diagnostic
Why did token cost fall while cost per resolved task rose?
A unit-economics diagnosis for AI products where cheaper inference is offset by retries, failures, latency, escalation, and manual repair.
Direct answer
Token cost can fall while cost per resolved task rises when lower-priced calls increase retries, tool use, latency, failed outcomes, or human repair. Measure the whole attempt tree against a verified business outcome: model calls, cached input, tools, infrastructure, waiting, review, remediation, and unresolved work. Then compare cohorts at equal task difficulty instead of celebrating a lower average price per token.
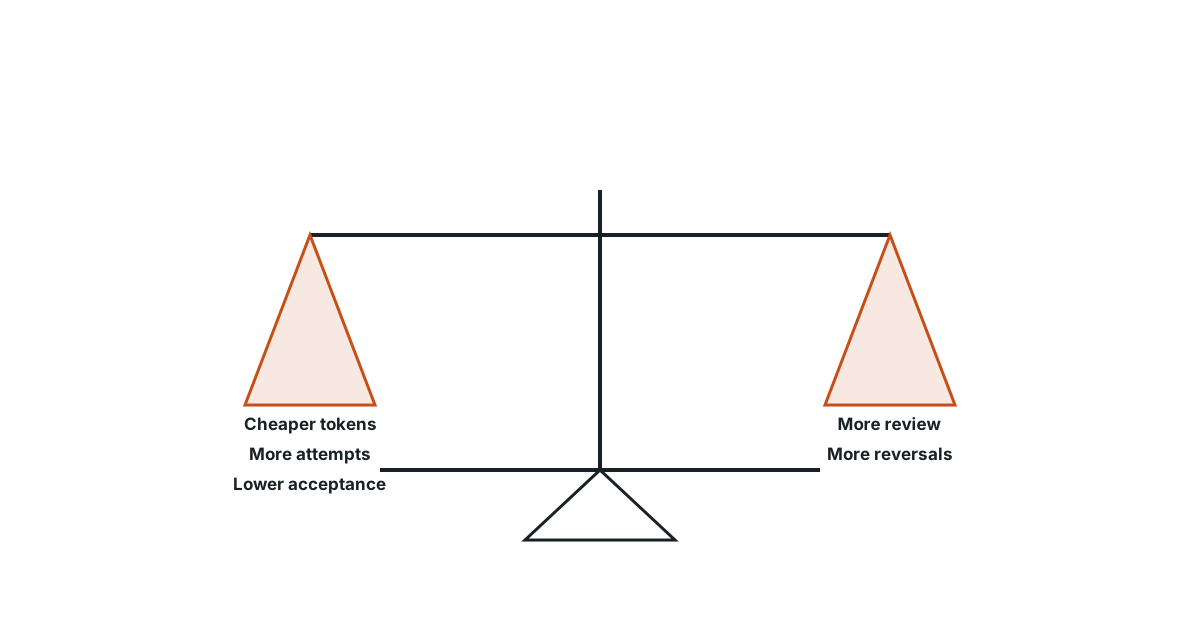
The paradox disappears at the outcome level
Use this guide after a model, prompt, caching, or routing change lowers reported token spend but finance, support, or operations sees no corresponding improvement. It diagnoses the divergence. The full design of a durable unit-cost metric is covered separately in the cost-per-outcome guide.
How cheap attempts multiply
Token price is a component price. A resolved task is a system outcome. Between them sit context assembly, repeated calls, tool execution, validation, fallbacks, queues, user abandonment, human review, and repair. Optimizing one component can move cost elsewhere.
A smaller model may generate a cheaper first answer but call tools twice, fail validation more often, or escalate cases that were previously automated. Aggressive context reduction can lower input tokens while increasing rework. Faster timeouts can create duplicate attempts. Even a true improvement can be hidden if the new cohort contains harder tasks.
A low-cost model with a retry spiral
Token price falls 35%, while attempts per resolved task grow from 1.2 to 2.6 and human review doubles. A matched-cohort ledger identifies routing uncertainty, not token price, as the dominant cost driver.
Decompose the matched cohorts
Choose one release boundary and build comparable before-and-after cohorts. Match or stratify by task type, difficulty proxy, customer tier, language, tool availability, and policy version. For every task, reconstruct the attempt tree rather than keeping only the final call.
Check five bridges:
- Price bridge: model and provider rates, cache classification, discounts, and currency.
- Usage bridge: calls, input/output tokens, tools, retries, fallbacks, and concurrency.
- Quality bridge: validation failures, incorrect effects, reopenings, and regressions.
- Labor bridge: review, escalation, support, and repair minutes.
- Outcome bridge: verified resolution, time to resolution, abandonment, and delayed reversal.
If the cohorts differ materially, report the mix shift before attributing the change to the model.
Repair the ledger and decision metric
Assign a stable task ID before the first model call and propagate it through model usage, tools, workflow state, review, billing allocation, and outcome verification. Record every attempt with a reason: primary, validation retry, transport retry, fallback, human-requested revision, or recovery.
Define resolution independently of model completion. A support draft is resolved when accepted under policy; an operational task is resolved when the intended effect is committed and verified; a research task may require citation checks. Add a fixed observation window for reopenings and compensation.
Use a waterfall to explain the change instead of one ratio. A team can then see that model cost fell by $X while tool load, review, or unresolved work rose by $Y.
Cost-per-outcome worksheet
Complete this worksheet for each matched cohort:
| Line | Before | After | Attribution question |
|---|---|---|---|
| Attempted tasks | Did volume or task mix change? | ||
| Verified resolutions | Is the outcome definition unchanged? | ||
| Primary model cost | Did price or token use change? | ||
| Retry and fallback cost | Which failure classes created extra calls? | ||
| Tool and infrastructure cost | Did work move outside the model API? | ||
| Human review and repair | What labor rate and time source were used? | ||
| Reversal/reopening cost | What happened after the first success signal? | ||
| Total attributable cost | Which shared-cost allocation rule applies? | ||
| Cost per attempt | Is this moving differently from outcome cost? | ||
| Cost per verified resolution | What confidence interval or range is credible? |
Analyses that compare unlike task mixes
- Dividing provider spend by successful API responses.
- Dropping failed and abandoned tasks from both cost and outcome reporting.
- Comparing releases with different task mix and calling the difference a model effect.
- Counting cached tokens at the wrong rate or ignoring shared-capacity allocation.
- Treating a short-term completion as resolved before validation or the reversal window.
Evidence
Unit economics should connect technology cost to a business-value unit rather than stop at aggregate spend.
The FinOps Framework describes unit economics as the relationship between technology cost and business value and emphasizes unit metrics for decision-making.
Primary source · official-doc · checked Aug 26, 2026
Limit: The framework is general cloud-financial guidance and does not define a resolved AI task or the attribution rules below.
Provider usage records expose dimensions of model consumption, but those records do not by themselves establish task resolution.
The OpenAI Usage API reference documents usage and cost endpoints and their available grouping and filtering dimensions.
Primary source · official-doc · checked Aug 26, 2026
Limit: It is provider-specific, mutable documentation; billing records do not include all tool, infrastructure, labor, or business-outcome costs.
Outcome cost should be computed from attributable attempts and downstream repair, with unresolved tasks retained in the denominator logic.
The worksheet below reconciles technical cost with a verified outcome and exposes shifts in failure and manual intervention.
Signal Studio author framework · reviewed Aug 26, 2026
Limit: Attribution windows and outcome definitions are product decisions and can be distorted by delayed effects or task-mix changes.
Limitations
The worksheet does not solve causal attribution when several systems or people contribute to an outcome. Delayed resolutions, changing task difficulty, free-tier credits, reserved capacity, and shared infrastructure require explicit allocation rules and sensitivity analysis.
FAQ
- Should unresolved tasks be excluded because they have no outcome?
- No. They consumed resources and are central to the diagnosis. Report cost per attempted task, resolution rate, and cost per verified resolution together, with the unresolved cohort visible.
- Can a cheaper model still be the right choice?
- Yes. It may dominate for a suitable task slice or as one stage in a routed system. Compare quality, latency, escalation, and outcome cost within matched slices.
Related guides
Continue within AI cost engineering, or use one of these adjacent diagnostics:
Editorial QA: automated native-English, structure, source-presence, and link checks completed . This record is not an independent expert endorsement. Review boundary.